An automated shoreline identification method was developed using standard image processing, geographic information system (GIS) techniques (https://woodshole.er.usgs.gov/project-pages/DSAS/version4/), and 2-m synthetic aperture radar (SAR) HH amplitude data. The development used five NASA Uninhabited Aerial Vehicle SAR (UAVSAR) images collected in summer and one in fall from 2009 to 2012. The wetlands in the images were dominantly fronted by vegetated shorelines along the Mississippi River Delta that were affected by severe storms, relative sea-level rise, and toxic releases. In comparison to shorelines photointerpreted from 0.3-m and 1-m orthophotography, the automated GIS 10-m alongshore sampling found SAR shoreline mapping accuracy to be ±2 m. The high accuracy was obtained even though water levels differed between the photography and SAR image pairs and included all shorelines regardless of complexity. The SAR mapping technology is highly repeatable and extendable to other SAR instruments with similar operational functionality. The high reliability of this on-demand mapping system was documented in its application following the Deepwater Horizon oil spill. Shoreline change maps created from before to after the spill showed that the oil spill caused substantial loss of coastal wetlands, shoreline erosion magnitude increased with oiling severity, and oil-related erosion distinctly differed from storm-related shoreline erosion (http://onlinelibrary.wiley.com/doi/10.1002/2016GL070624/full).
https://doi.org/10.14358/PERS.83.3.237

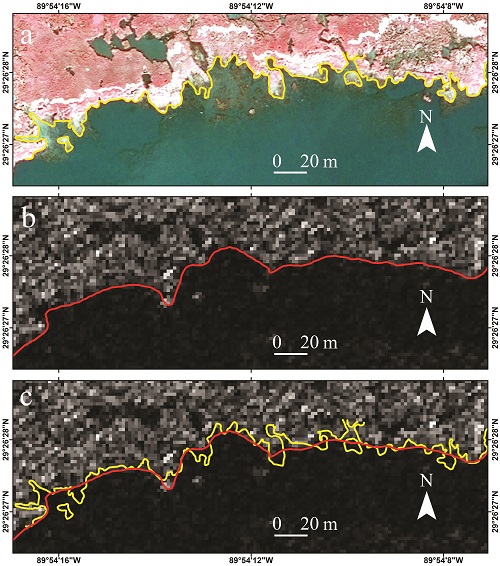
(a) October 2012 Digital Orthophoto Quarter Quarter Quadrangle (DOQQQ) photography and interpreted shoreline, (b) October 2012 HH amplitude image and created shoreline, and (c) overlay of the interpreted and SAR-based shorelines. The degrading and contorted coast is correctly interpreted as a highly complex shoreline, while the SAR shoreline represents a reasonable rendition that is amenable to operational processing. The SAR-based mapping provides a consistent progression of shoreline recession even though the shoreline becomes increasingly complex.

