
The flow of water in a river channel redistributes various materials, including organisms and pollutants, through a process called dispersion. Understanding this mechanism is critical for applications ranging from species conservation to hazardous waste management. Tracer tests with a visible dye are often used to study dispersion, typically by measuring dye concentration directly in the field at a few fixed locations. Although this approach records passage of the dye pulse over time, it fails to provide the spatial information needed to identify areas of transient storage where materials might be detained and to evaluate numerical models of dispersion. To overcome this limitation of traditional tracer studies, the USGS Geomorphology and Sediment Transport Laboratory is pursuing a remote sensing approach for characterizing dispersion in river channels.
In May 2017, the USGS research team traveled to a unique outdoor flume facility, the River Experiment Center of the Korea Institute of Civil Engineering and Building Technoloyg in South Korea, to perform a series of tracer tests in a channel of varying sinuosity. During each test, the team made direct measurements of Rhodamine dye concentration and acquired hyperspectral images from an unmanned aircraft system (UAS). The UAS was deployed in both a hovering mode to observe movement of the dye past a single cross section over time and along flight lines to obtain images capturing spatial variations in concentration during the tracer tests. Researchers used an Optimal Band Ratio Analysis (OBRA) algorithm to establish strong correlations between reflectance and dye concentration across a broad range of wavelength combinations.
The USGS team also conducted a large-scale tracer test on the Kootenai River in Idaho in September 2017. This study involved measuring concentrations during the dye release using sondes anchored at several fixed locations and towed back and forth across a transect. Applying OBRA to the sonde data and both field spectra and hyperspectral images acquired from a manned aircraft yielded strong relationships between band ratios and Rhodamine concentration. These results demonstrate the potential to produce detailed, accurate maps of dye dispersion via spectrally based remote sensing.
Whereas traditional tracer studies based on sparse field measurements yield limited spatial information, the ability to infer concentrations from remotely sensed data will enable more thorough evaluation and refinement of numerical models and thus foster novel insight into dispersion processes. In addition, remote sensing could facilitate response to contamination incidents, which occur frequently in South Korea, and management of critical species of concern, such as endangered sturgeon on the Kootenai River in Idaho.
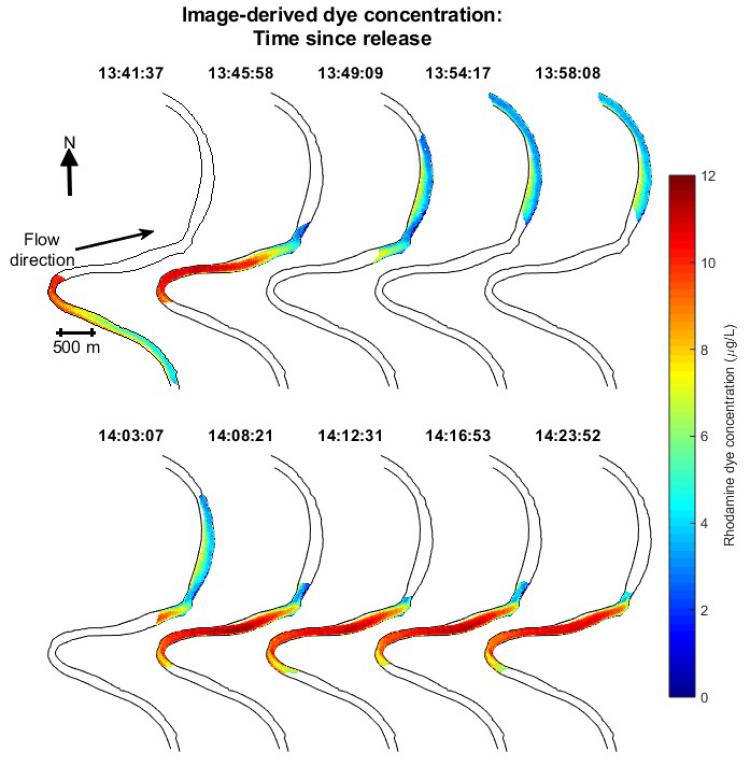
Time series of dye concentration maps produced from non-overlapping hyperspectral images acquired along sequential flight lines as a pulse of Rhodamine dye moved down the Kootenai River, Idaho. An Optimal Band Ratio Analysis (OBRA) algorithm was used to derive a relationship between reflectance and concentration that was then applied to the images to create these maps.