
California’s croplands cover roughly 3.8 million hectares (ha) with crop products valued at $33 billion USD according to the UDSA’s 2017 Census of Agriculture. Because of the value of these areas, monitoring surface water inundation in croplands is of interest for disaster preparedness and water management. Sources of inundation include both intentional irrigation and unintentional flooding. Irrigation accounts for most intentional water inundation in California’s croplands, since nearly 90% of crops grown in California rely on irrigation. Surface irrigation, whereby fields are flooded and water flows across the surface, is the most common type of irrigation practiced in the State.
While many crops are intentionally inundated, unintentional flooding is also a threat to agricultural yields. More than 1.1 million ha of California’s croplands are located within the 500-year flood plain, representing nearly $7 billion USD in crop value. Although drought conditions are predicted to increase in frequency as the climate changes, so too are extreme precipitation events that contribute to flooding. As a result, monitoring surface water inundation that results from flooding can help farmers and resource managers with risk assessments for crop types and locations.
Using satellite imagery, patterns of surface water inundation can be observed in California’s croplands at frequent time scales across the entire State. Researchers examined eight different crop types to extract patterns of inundation from 2003 to 2020. They then utilized the computational power of the cloud-based image processing platform Google Earth Engine to quantify monthly composite images of surface water and extract inundation for each crop type.
Results indicate that rice crops have high winter and spring surface water inundation, which was expected based on typical irrigation patterns. Relatively high surface water inundation was also found in grain and field crop types. During winter months, citrus crop parcels show a mean inundation between 1 and 1.3%, suggesting unintentional flooding. Regions with high proportions of surface water extent in relation to crop area include the northern Sacramento River valley, where rice is predominantly grown, and the southern San Joaquin River valley, which produces a large portion of the State’s deciduous and grain crops.
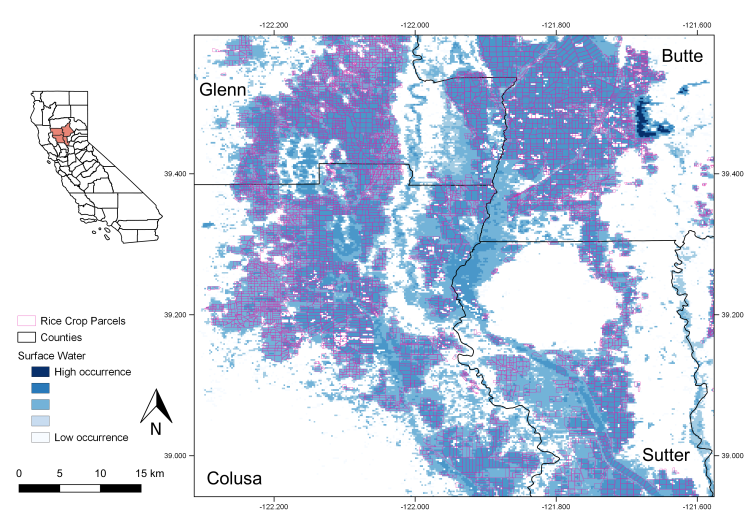
Surface water inundation from low to high occurrence from 2003–2020 in California rice croplands in the northern Sacramento River valley.