
Developing maps of exotic annual grass (EAG) phenology allows researchers and land managers to track the timing and progression of EAG growing-season dynamics year to year. Alterations in phenology patterns can indicate changing environmental conditions such as progressively warming temperatures, which can cause the growing season to start earlier. In the western United States, EAGs have invaded shrub ecosystems for more than a century, and in that time a positive feedback cycle between fire and EAGs has developed. This feedback cycle has resulted in more fine fuels, which have increased wildfire frequency. If the growing season starts earlier in areas invaded by EAGs, the fire season could be extended and fire frequency could increase even more, exacerbating a rapidly deteriorating situation.
This research used Harmonized Landsat 8/Sentinel-2 (HLS) satellite data to develop near-seamless, cloud-free Normalized Difference Vegetation Index (NDVI) data, which measures vegetation greenness. The NDVI data were used to build a model training dataset of phenology metrics in EAG-invaded areas. Analysts examined NDVI profiles at more than 11,000 pixels to identify NDVI-based metrics for 4,014 training data points stratified by ecoregion. The training data points were incorporated into a machine-learning framework along with environmental variables like elevation and solar radiation and used to develop models of phenology metrics. The model algorithms were then input into mapping software and extrapolated over the entire study area, creating Start of Season Time (SOST) and five other phenology metrics for 2017–2021. Researchers calculated and mapped two metrics, Amplitude and Duration, using SOST and End of Season Time data. They then evaluated the accuracy of the phenology metric maps using five independent cross validations, yielding median Pearson’s r values that ranged from 0.88 to 0.95.
The EAG phenology metrics were tested as drivers in a model that estimated the abundance (percent cover) of EAG. Adding the metrics as drivers showed promise as the model accuracy improved; the median absolute error decreased from 5.70 to 5.66 percent cover. The time series of EAG phenology metrics can increase understanding of EAG dynamics and help land managers develop plans to protect native habitat, wildlife, recreational areas, and air quality. The associated manuscript is available here and the data can be obtained here.
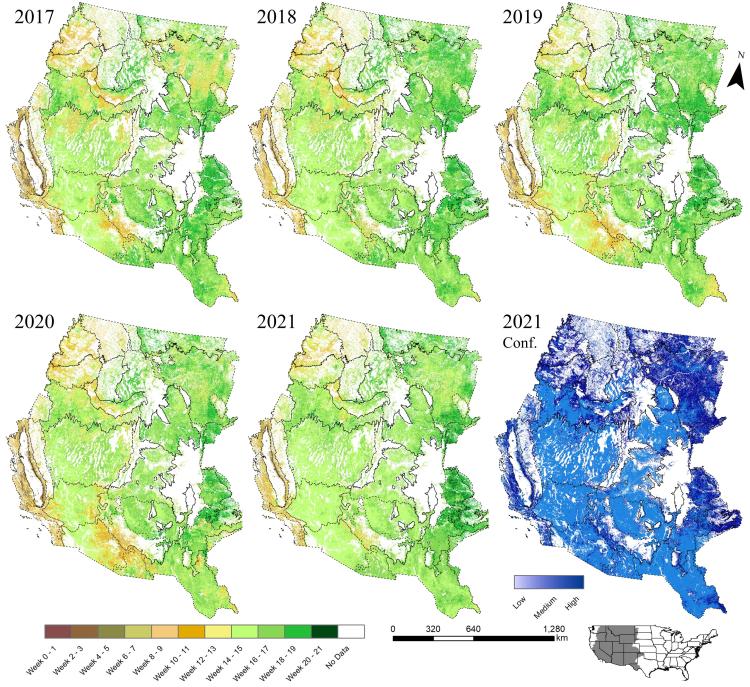
Start of season time (SOST) for exotic annual grass from 2017–2021 with Level III Commission for Environmental Cooperation (CEC) ecoregion boundaries overlaid. Week 0 represents the last week (week 52) of the previous year. The confidence map shows the pixel-by-pixel confidence level for SOST in 2021. The associated manuscript is available here.
Disclaimer: Any use of trade, firm, or product names is for descriptive purposes only and does not imply endorsement by the U.S. Government.