
The conversion of natural land cover to built-up surfaces has been widely documented as the main determinant of warming across urban areas, since buildings, roads, and other infrastructure absorb and reemit heat from the Sun more than natural landscapes. This land conversion process influences both canopy and surface urban heat intensities, resulting in urban heat islands (UHIs). UHIs have a profound effect on the lives of urban residents and can exacerbate the risk of heat-related mortality associated with global climate change. Heat waves have the potential to substantially affect human health, energy demand, and human and ecosystem health challenges. As the climate of the Earth warms, hotter-than-usual days and nights are becoming more common, and heat waves are expected to become more frequent and intense. Measures of UHI intensity complement trends in urban temperature as indicators of the effects of changing climate conditions over time.
The U.S. Geological Survey (USGS) and U.S. Environmental Protection Agency (EPA) have developed an interagency effort to integrate Landsat surface temperature data and annual land cover change information from the 1980s to the present to monitor and assess UHI effects in the United States. The integration of surface temperature and land cover dynamics provides fundamental measurements for UHI intensity and temporal trends in urban locations. The UHI change analysis also identifies thermal characteristics in the urban-wildland interface and UHI hotspots that are vulnerable to intense heat waves. Annual UHI patterns and trends are created as indicators of the effect of climate variation on a wide range of ecosystems processes, particularly if these extreme warming events occur frequently and more quickly than society and ecosystems can adapt.
A data processing and analysis system has been developed at the USGS Earth Resources Observation and Science (EROS) Center. The system processes all Landsat surface temperature records in 50 cities in the conterminous United States. By comparing surface temperatures in urban and nonurban areas, UHI intensities and their temporal trends were calculated between 1985 and the 2010s in six prototype cities: Atlanta, Georgia; Houston, Texas; Minneapolis, Minnesota; Sioux Falls, South Dakota; Phoenix, Arizona; and Seattle, Washington. Different patterns of trends of UHI intensities have been found in these six cities. Temporal variations of UHI intensity indicate positive trends in five cities with magnitudes of 0.2–0.6 degrees per decade but a slightly negative trend in Phoenix. The positive trends of UHI intensity are more apparent in warm and wet climate regions than in dry regions.
The primary products available here are annual maps of mean and maximum surface temperatures for the 50 cities. The prototype approach has been published in peer-reviewed journal articles and is being implemented to investigate UHI in the rest of the selected U.S. cities. The results of UHI intensity change from the six selected cities have been provided to the U.S. Global Climate Research Program (USGCRP) 5th National Climate Assessment (NCA5). The datasets will continue to be made available for other major U.S. cities for inclusion in the USGCRP and EPA climate indicator sets. The accompanying USGS Fact Sheet is available here.
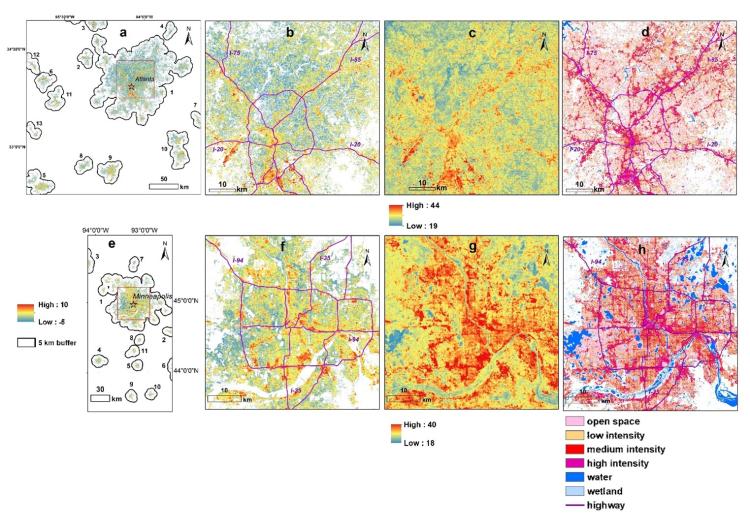
Urban heat island (UHI) intensities in the Atlanta (a) and Minneapolis (e) study areas. 2016 UHI intensity, land surface temperature, and the four urban land cover types in the zoomed in areas in Atlanta (b-d) and Minneapolis (f-h). Interstate highways are colored in purple. The zoomed in areas represent the Atlanta and Minneapolis metropolitan areas. The water and wetland in these zoomed in areas in Atlanta and Minneapolis are also displayed in panels d and h. Fig. (a) and (b), (c) and (f) have the same color legends. The associated manuscript is available here.
Disclaimer: Any use of trade, firm, or product names is for descriptive purposes only and does not imply endorsement by the U.S. Government.