
The USGS Patterns in the Landscape–Analyses of Cause and Effect (PLACE) project has developed a new suite of surface water maps derived from Moderate Resolution Imaging Spectroradiometer (MODIS) imagery. These maps leverage the MODIS daily acquisition rate and the Dynamic Surface Water Extent (DSWE) algorithm to create a record of surface water change with reduced cloud obstruction compared to Landsat-based maps. These data are being used to assess 21st century surface water dynamics across the conterminous United States. The research team used the cloud-computing Google Earth Engine platform to derive monthly totals of surface water extent from 2003–2019 from the MODIS-based product. They measured the direction and intensity of the surface water trends seasonally and annually within U.S. Environmental Protection Agency ecoregions . They also correlated surface water extent with monthly precipitation totals. Results show decreasing surface water across portions of the western and southwestern U.S. as well as in the east-central U.S. and Appalachian Mountains; increasing surface water trends were identified annually along the Great Plains, particularly east and north of the Colorado Rocky Mountains. On a seasonal scale, increasing trends were observed in the lower Mississippi River basin in the spring while decreasing trends were identified in the western Great Lakes region in the summer. Monthly precipitation amounts were generally positively and strongly correlated to surface water extent across the United States and for most ecoregions. Overall, the time series of higher frequency water maps help support water-management decision-making by providing important information about the spatial and temporal trends of surface water.
https://www.usgs.gov/centers/wgsc/science/patterns-landscape-analyses-cause-and-effect
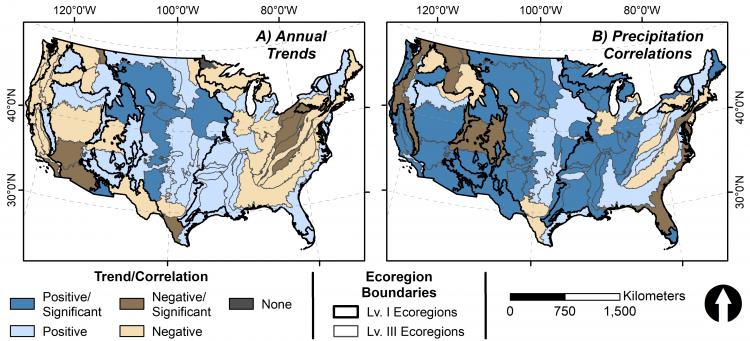
Maps show (A) surface water trends on an annual scale and (B) monthly correlations between precipitation and surface water for all Level III U.S. Environmental Protection Agency (EPA) ecoregions across the conterminous United States. Positive trends/correlations are shown in blue and negative trends/correlations are shown in brown. Darker shades indicate significant results (p <= 0.05).