The effusion rate of lava during a volcanic eruption is of fundamental importance in volcanology, given its direct association with hazards. In basaltic systems, like those of Hawaii, effusion rate exerts a primary control on lava flow length and is a critical input to models of lava flow development and path forecasting. Unfortunately, since 2008 traditional measurements of lava effusion have not been possible at Kilauea volcano, which has been erupting since 1983 and is one of the most active volcanoes in the world.
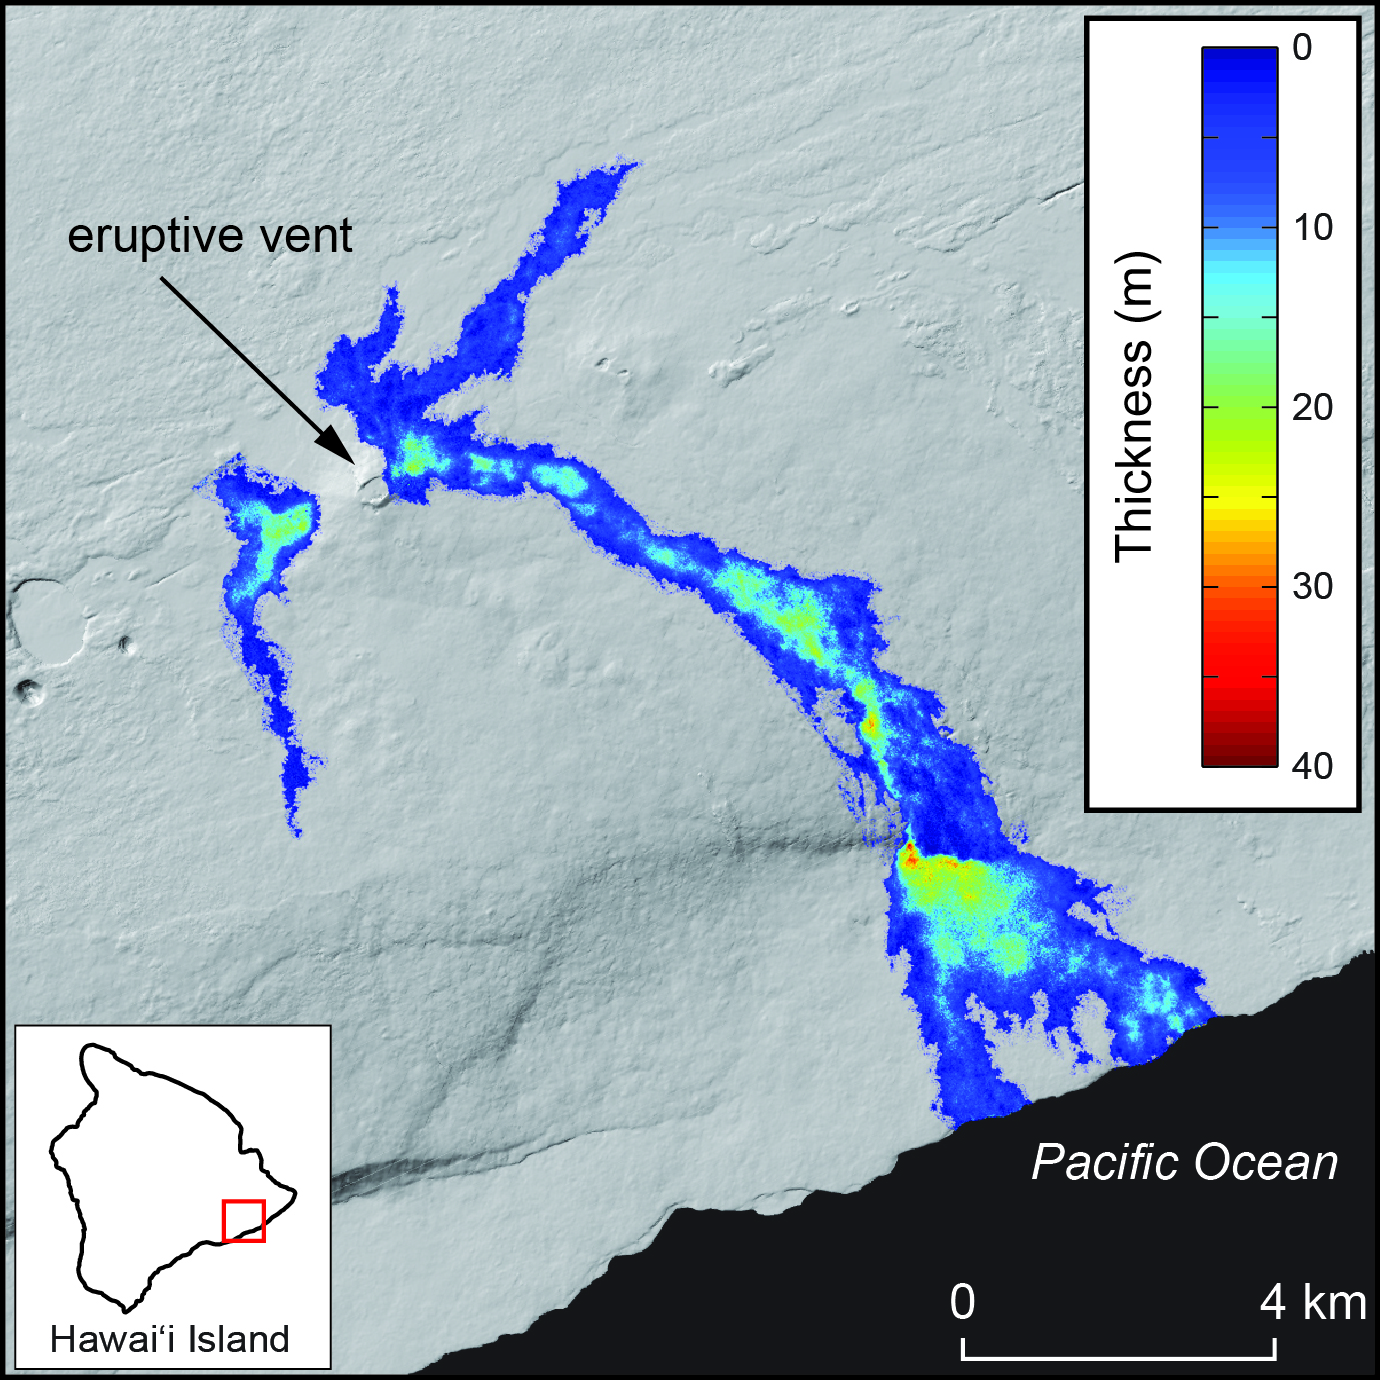
Data from the TanDEM-X satellite system provides a new method for quantifying the effusion rate of lava at Kilauea and other volcanoes. TanDEM-X consists of two SAR satellites that simultaneously acquire images of the surface, allowing for construction of a digital elevation model (DEM) that represents a snapshot of topography at any given time. By differencing TanDEM-X-derived DEMs of Kilauea’s lava flow field acquired at different times, it is possible to measure topographic changes in the surface that are caused by emplacement of a volume of lava. Dividing the volume change by the time spanned, it is possible to derive the effusion rate. During mid-2011 through mid-2013, this method revealed that over 120 million cubic meters of lava erupted from Kilauea and was emplaced on land (lava that flowed into the sea, which occurred for about 7 months of the 2-year span, could not be measured). These data indicate the rate of lava emission at Kilauea during the time period was about half the long-term average, suggesting that, compared to previous years, a greater proportion of magma was being stored in the subsurface and had not erupted, or the supply of magma from depth to the volcano had decreased.
http://volcanoes.usgs.gov/activity/methods/insar/

Map of lava flow thickness on Kilauea volcano for activity that occurred during July 2011–June 2013, overlain on a shaded relief map of the region. Data are derived from differencing DEMs that were produced from TanDEM-X satellite SAR imagery. Color indicates lava flow thickness. Gray areas were not covered by lava flows during the time spanned.

