Monitoring productivity in coastal wetlands is important due to their high carbon sequestration rates and potential role in climate change mitigation. We tested agricultural- and forest-based methods for estimating the fraction of absorbed photosynthetically active radiation (f APAR) in a restored, managed wetland with a dense litter layer of non-photosynthetic vegetation. FAPAR is a key parameter for modelling gross primary productivity (GPP). We then compared the difference in canopy light transmission between a managed wetland and a tidally influenced wetland in the Sacramento-San Joaquin River Delta in California. A LI-COR LI-190 point quantum sensor and a LI-COR LI-191 line quantum sensor were used to collect incoming PAR (Qb) and transmitted PAR (Qa), respectively, where fAPAR = [1 − (Qa/Qb)] . The presence of litter reduced correlations between spectral vegetation indices and f APAR. In the managed wetland, a two-band vegetation index incorporating simulated WorldView-2 or Hyperion green and near-infrared bands, collected with a field spectroradiometer, significantly correlated with f APAR only when measured above the litter layer, not at the ground where measurements typically occur. Measures of GPP in these systems are difficult to capture via remote sensing and require an investment of sampling effort, practical methods for measuring green leaf area, and accounting for background effects of litter and water.
Schile, Byrd, Windham-Myers and Kelly. 2013. Remote Sensing Letters 4(6).
http://www.tandfonline.com/doi/abs/10.1080/2150704X.2013.766372#.U0cDCvldVMV

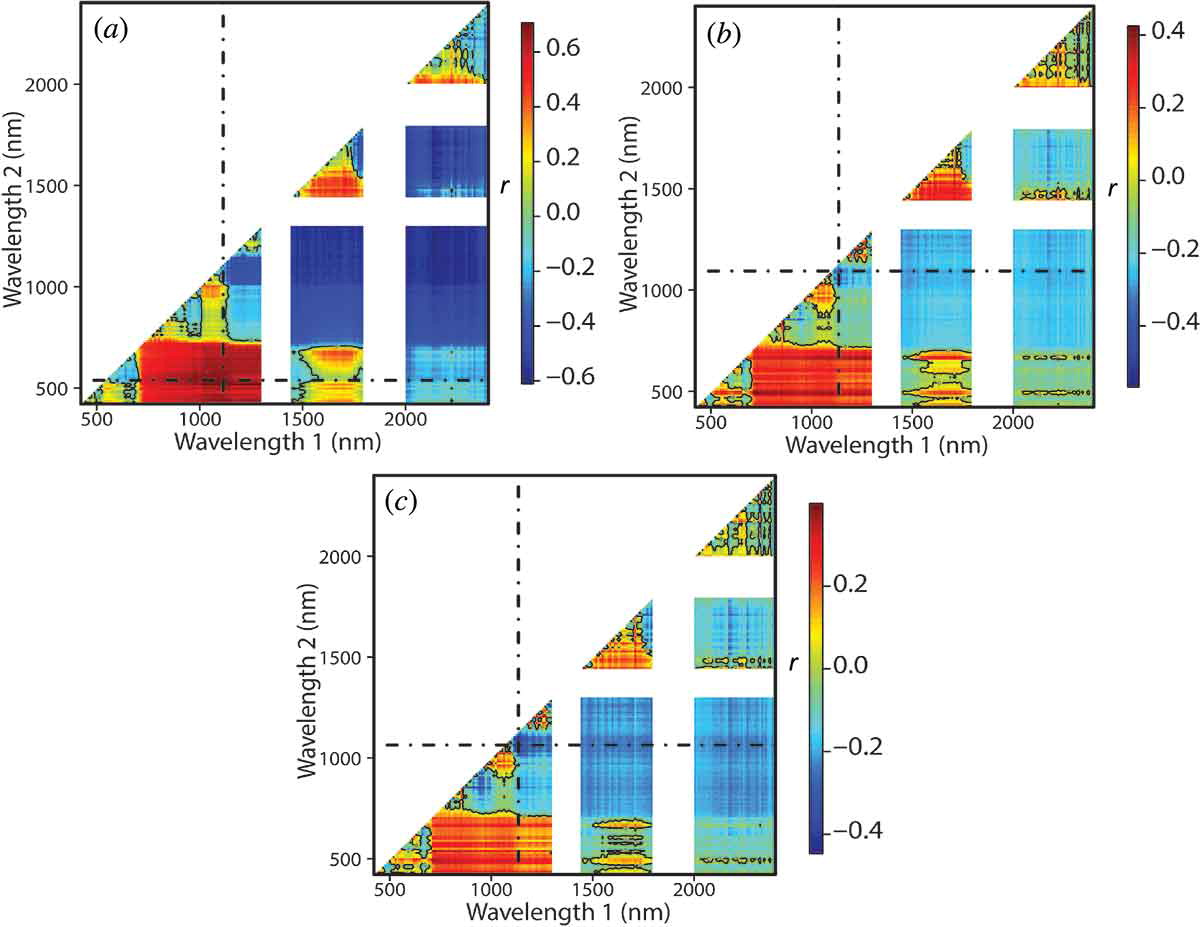
Contour plots of the correlation between (a) f APAR-high, (b) f APAR-mid, and (c) f APAR-low values and two-band vegetation indices (TBVI) using all combinations of 164 Hyperion bands simulated using spectroradiometer data collected at Twitchell Island in the Sacramento-San Joaquin River Delta, California . Dashed lines intersect at band combinations with the greatest correlation.

