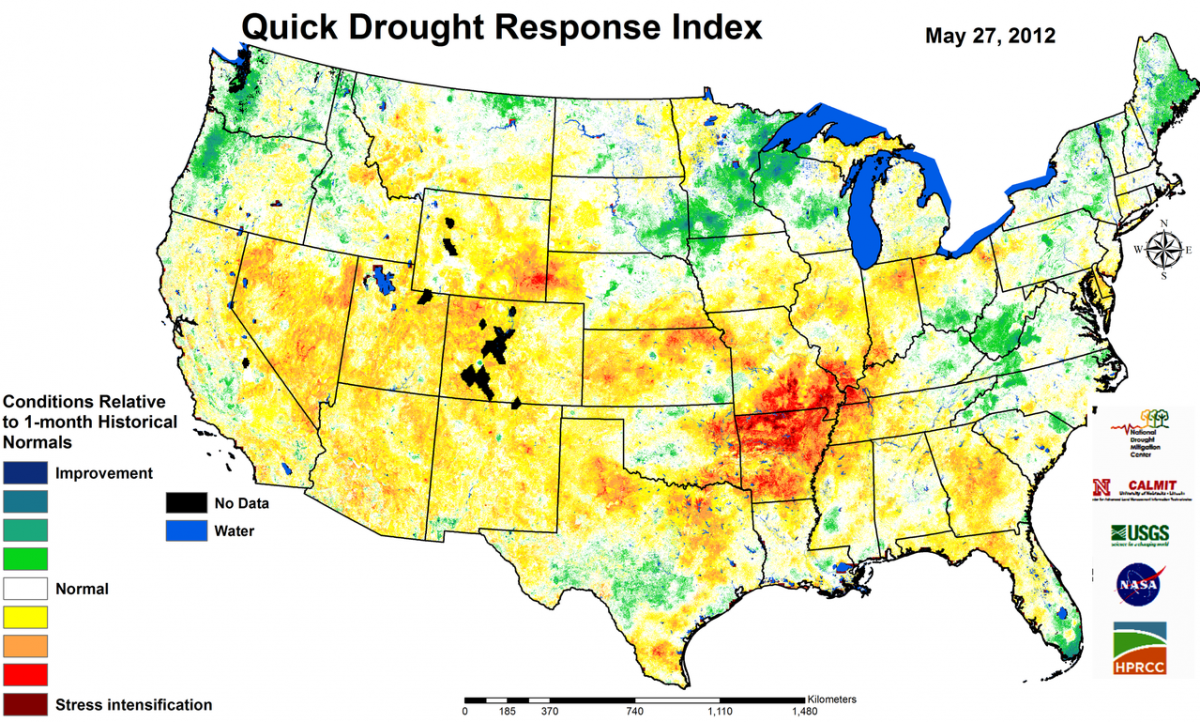
Drought is an equal-opportunity natural hazard: it can strike any part of the country at almost any time. Drought conditions can vary tremendously across space and time, from short, extreme events that often involve high temperatures and greatly decreased precipitation, to season-long episodes of extended precipitation deficits. Despite the inherent variability in drought events, they are often associated with many negative effects on crops, livestock, water supply, wildlife and their natural habitats, and human health. No two droughts are alike and, as a result, many types of observations and models are used to monitor drought conditions. A new indicator, called the Quick Drought Response Index, or QuickDRI, is being developed to fill the need to identify and characterize rapidly developing, flash-drought events. QuickDRI provides complementary information to another seasonal drought indicator, the Vegetation Drought Response Index, or VegDRI.
QuickDRI serves as a drought alarm and is designed to have improved sensitivity to early-stage drought conditions and rapidly evolving drought events. This index is calculated using similar methods to VegDRI. QuickDRI models incorporate multiple remote sensing- and climate-based input variables that portray key components of the hydrologic cycle influencing drought-related vegetation stress (for example, evapotranspiration [ET], soil moisture, and vegetation index-based plant health).
The QuickDRI project involves researchers at the National Drought Mitigation Center and the Center for Advanced Land Management Information Technologies at the University of Nebraska–Lincoln, the USGS Earth Resources Observation and Science Center, the U.S. Department of Agriculture’s Agriculture Research Service, and the Land Data Assimilation Systems at NASA Goddard Space Flight Center. Weekly operational QuickDRI maps are expected to be in regular production in late summer 2016 and available from an interactive viewer at the Monitoring Vegetation Drought Stress website (http://vegdri.cr.usgs.gov/).

Example of the Quick Drought Response Index (QuickDRI) for May 27, 2012. The index reflects increasing stress on vegetation especially across southern Missouri, southern Illinois, and northern Arkansas. This regional pattern coincides with much higher than normal temperatures and much lower than normal precipitation during April and May.

