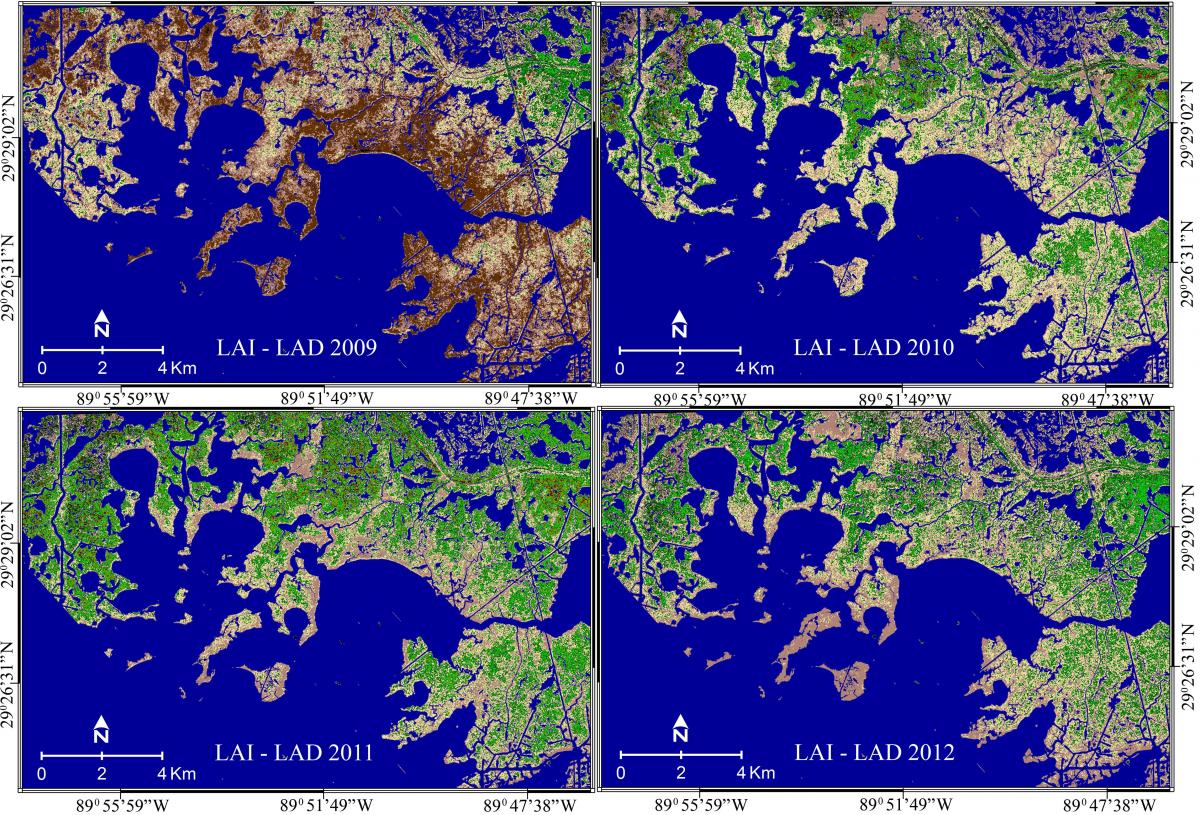
The coastal marsh within Barataria Bay on the western side of the Mississippi River Delta was heavily impacted by the 2010 Deepwater Horizon oil spill. Polarimetric synthetic aperture radar (PolSAR) and field data were collected near-concurrently in the summers of 2010, 2011, and 2012 in the north-central Gulf of Mexico to assess the condition of coastal marshes, including Barataria Bay. PolSAR data alone were collected in 2009. Empirical relationships between field-derived leaf area index (LAI) and leaf angle distribution (LAD, average orientation) and PolSAR-based biophysical indicators were created and applied to map S. alterniflora (saltmarsh cordgrass) marsh canopy structure. The classified sequence and spatial pattern of marsh structure maps from 2009 to 2012 revealed a structurally dynamic marsh landscape that was not perceived by the multitude of optical to radar sensors and photointerpretation used to detect change within this high profile region. The dynamic change patterns documented in the independent classifications offer a compelling history of progression from year to year. This study demonstrates the unique perspective on marsh biophysical change offered by PolSAR marsh structure mapping to the study of terrestrial ecology. The developed mapping was based on the NASA Unmanned Aerial Vehicle Synthetic Aperature Radar (UAVSAR) L-band system, which is similar to that of the Japanese Aerospace Exploration Agency (JAXA) ALOS-2 and to that designed for the NASA-ISRO SAR Mission (NISAR) mission.
http://www.mdpi.com/2072-4292/7/9/11295

The images show coastal marsh within Barataria Bay on the western side of the Mississippi River Delta heavily impacted by the 2010 Deepwater Horizon oil spill. LAI-LAD classes (2009 to 2012). (Legend Pattern Color = LAI Range, LAD Range) Dark Brown = 1.6, 0.67, Brown = 2.5 to 2.8, 0.61 to 0.67, Light Tan = 3.6 to 4, 0.52 to 0.72, Dark Green = 4.8 to 5.3, 0.44 to 0.62, Light Green = 5.9 to 6.5, 0.41 to 0.5, Minor classes Olive and Reds = 7.2 to 11, 0.31 to 0.4.

