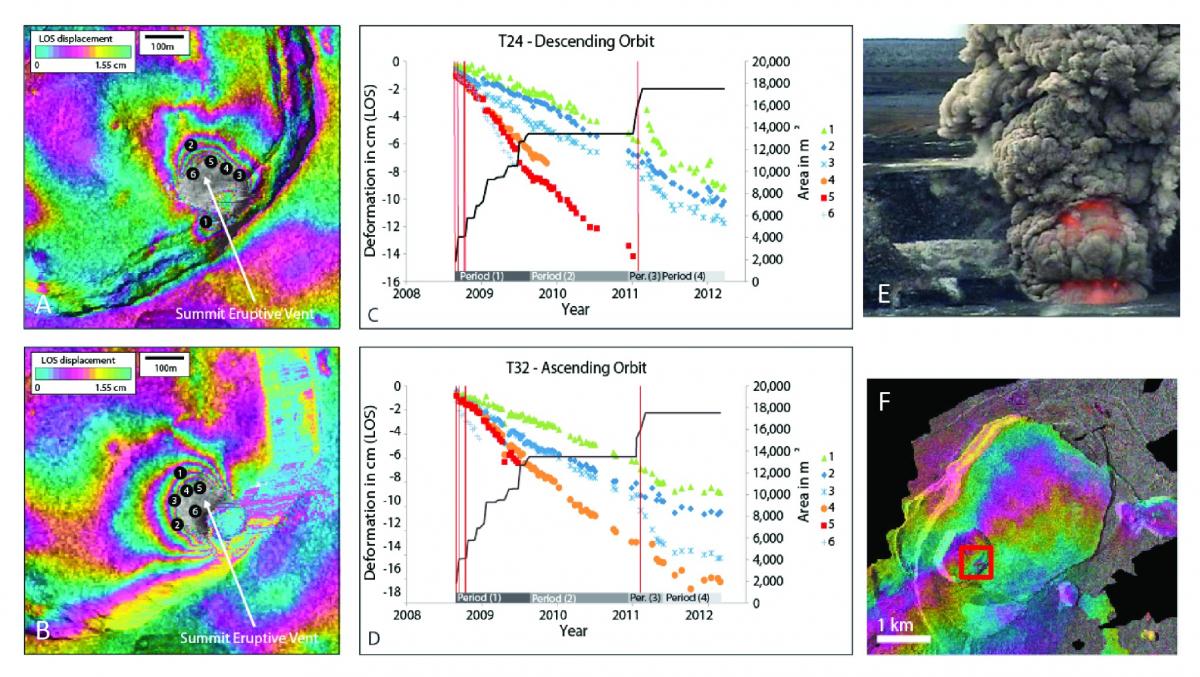
Measuring surface motion at Kilauea and Mauna Loa volcanoes is critical for tracking eruptive activity and volcanic unrest in Hawaii. Scientists at the USGS Hawaiian Volcano Observatory utilize a network of ground-based GPS sensors and borehole tiltmeters to monitor ground deformation, while also making use of satellite-based interferometric synthetic aperture radar (IFSAR) data. In 2012, IFSAR data were obtained from TerraSAR-X (jointly operated by the German Aerospace Center and EADS Astrium) and COSMO-SkyMed (operated by the Italian Space Agency) through the Hawaii Supersite—a Group on Earth Observations (GEO) initiative to make satellite and ground-based data available to scientists studying natural hazards. IFSAR results from Kilauea Volcano documented inflation of the summit over the course of 2012. Superimposed on this inflation was small-scale deflation around Kilauea’s summit eruptive vent (see figure). This highly localized deformation occurs in an area that is inaccessible and highly hazardous, and so the deformation is detectable only via satellite IFSAR.
http://supersites.earthobservations.org/hawaii.php
 Average line-of-sight (LOS) velocities (left; A and B) and time series (middle; C and D) for TerraSAR-X descending (T24; A and C) and ascending (T32; B and D) orbital paths.
The LOS velocities are georeferenced and overlain on the SAR intensity images. Numbers on each velocity map indicate the locations of pixels in the corresponding time series. Black lines in the time series give vent area over time (determined from visual observations), and red vertical bars mark small explosions from the summit vent. Grey bars above the x axis mark four time periods of vent rim deformation style, with periods 1 and 3 representing times of vent area growth, and periods 2 and 4 of relative vent stability. Periods of greater subsidence correspond to times of vent growth and occasional hazardous explosions (see photo at upper right; E), as material that collapses from the vent rim impacts the lava lake within the vent. TerraSAR-X interferogram in lower right (F) shows deformation of Kilauea Caldera during January 19 – April 17, 2009, and displays the area covered by the time series and average LOS maps.

