The USGS conducts national-scale mineral resource and geoenvironmental assessments to map and characterize mineral exposures related to mined and unmined hydrothermally altered rocks and mine waste. The presence and mineralogy of altered rocks are important factors determining the occurrence of concealed mineral deposits. Investigations have determined sulfide-bearing altered rocks and mine waste are diffuse sources of acidic solutions that can transport metals into the hydrologic system. These rocks and waste materials contain minerals that can be identified using spectral analysis remote sensing data.
The efficacy of airborne spectroscopic, or “hyperspectral,” remote sensing for geoenvironmental watershed evaluations and deposit-scale mapping of exposed mineral deposits has been previously demonstrated. However, the acquisition, processing, and analysis of such airborne data at regional and national scales can be time and cost prohibitive. To support development of the new Mineral Deposit Database, satellite-based multispectral remote sensing data from the Advanced Spaceborne Thermal Emission and Reflection Radiometer (ASTER) and Landsat 7 ETM+ sensors are being analyzed to generate uniform maps of minerals and green vegetation over large areas of the United States. New algorithms are currently being developed to incorporate data acquired by the recently-launched Landsat 8, which include additional spectral bands that enhance the ability to identify minerals associated with sulfide oxidation.
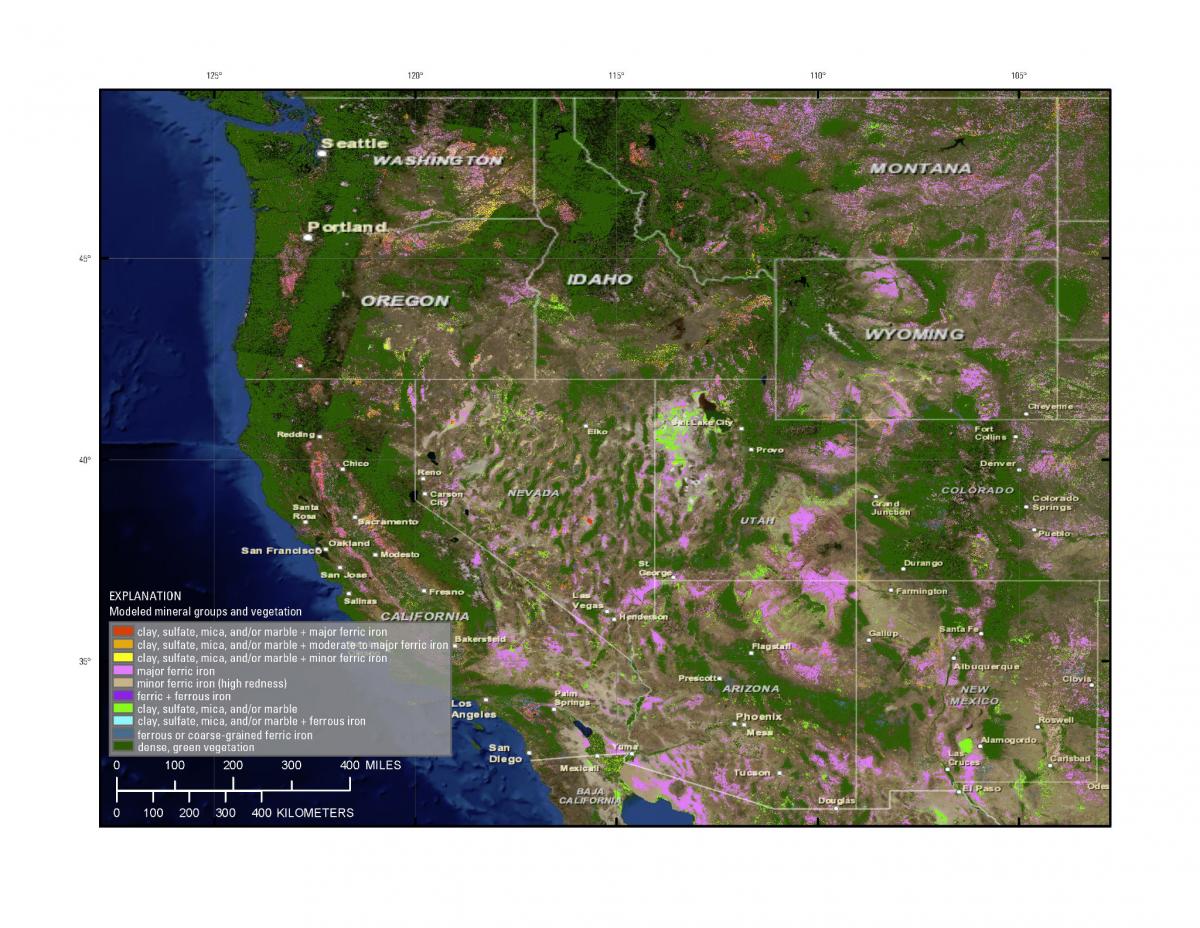
Map of mineral groups and green vegetation modeled from Landsat 7 ETM+ data covering the western United States. This map and other more detailed maps generated by analysis of ASTER satellite data are currently available online to all USGS personnel using Esri ArcGIS Server technology. The online map services also include highly detailed maps of selected areas generated from analysis of airborne spectroscopic data acquired by the Airborne Visible Infrared Imaging Spectrometer (AVIRIS) and HyMap sensors, including 638 line kilometers of AVIRIS-derived maps covering important mineral trends in northern Nevada. Efforts to make all maps available online to the public are underway. The map shown is published in USGS Scientific Investigations Map 3252 (in press).


