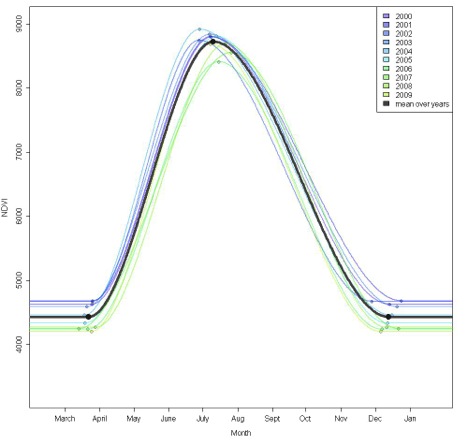
A cooperative study between the NPS, USGS, and NASA has developed a toolset to distribute summarized MODIS land surface phenology data and to graphically display phenological patterns observed at national parks and the surrounding landscape. The goal of the Land Surface Phenology Toolset is to provide remotely sensed phenological monitoring support to NPS Inventory and Monitoring (I&M) networks and parks. The toolset specifically addresses seasonal changes in plants, including the onset of growth, photosynthesis in the spring, and the senescence of deciduous vegetation in the fall.
The suite of tools is delivered as a toolbox written for ArcMap version 10.0. The tools are written in Python, which is a language commonly used by many GIS analysts. The functionality does require the commercial Environmental Systems Research Institute (Esri) ArcGIS package but this package is commonly used and is available at many public agencies. This toolset is being implemented as a “standard operating procedure” within the NPScape program.
Example of automated graphical output from the 'Summarize Phenology data for polygons' tool: Annual phenology curves that display normalized difference vegetation index values by month for a single area of interest.


