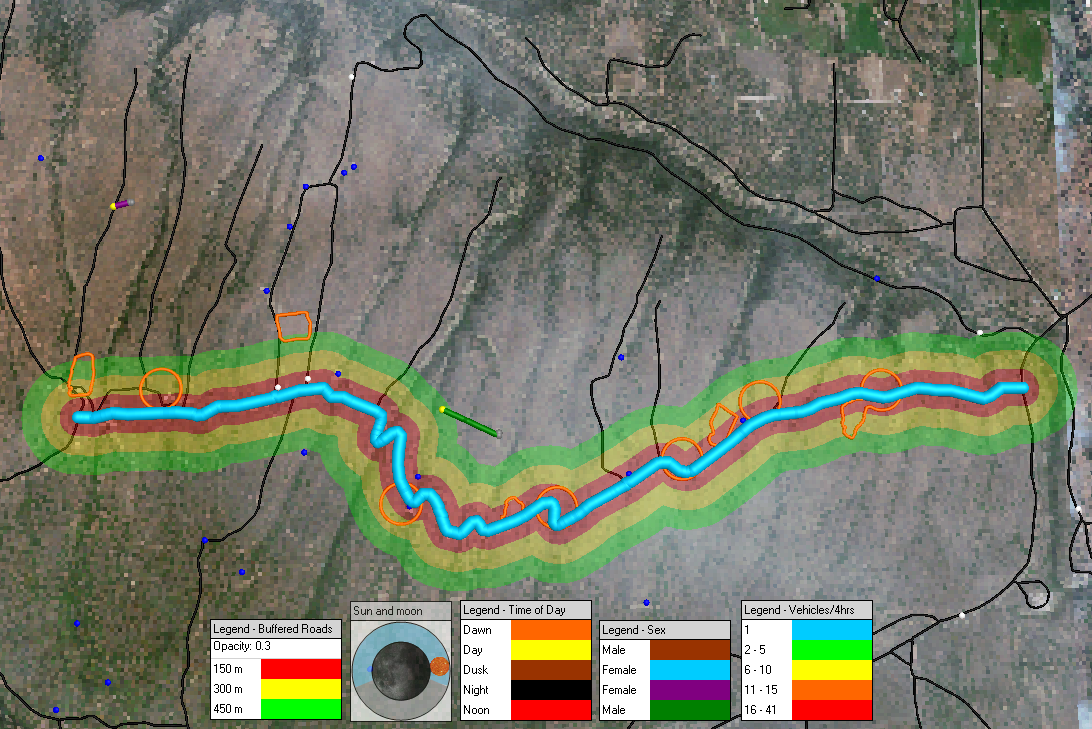
To investigate the effect of motorized use on Gunnison sage-grouse movements, the data from four birds fitted with GPS transmitters were analyzed in conjunction with vehicle counts based on pneumatic vehicle counters. GeoEye-1 satellite imagery was used as a backdrop in Eonfusion 4D visualization software, which displays Gunnison sage-grouse movement in relation to vehicle traffic through time.
Vehicles per 4 hours (light blue), road buffers, frozen movement of Gunnison sage-grouse (female – purple, male – green), Gunnison sage-grouse leks (orange), stock tanks (blue), and vehicle counters (white) with GeoEye-1 satellite image in the background.


